In the light of the Sustainable Development Goals, many studies are carried out to reduce the carbon footprint on our campuses and it has become one of the main targets.
To reduce carbon footprint,
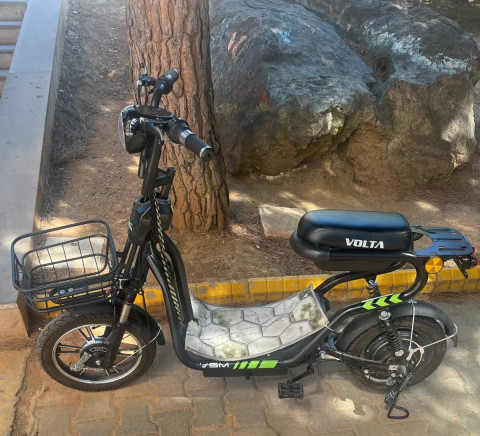
- It is aimed to reduce the use of vehicles on campus and switch to environmentally friendly transportation systems.
- It is aimed to reduce waste, recycle it, not use packaging that does not degrade in nature, and turn plant and animal waste into nature and turn it into fertilizer instead of throwing it away.
- It is aimed to benefit from sustainable and nature-friendly energy sources instead of fossil fuels.
- It is aimed to ensure energy efficiency by increasing heat insulation in buildings.
- It is aimed to reduce the carbon footprint by providing adequate ventilation in buildings.
- The use of energy efficient devices is encouraged.
- It is aimed to use environmentally friendly and low-emission public transportation vehicles instead of individual vehicles for transportation of employees.
The university plays an active role for a sustainable future by collaborating with various stakeholders to achieve these goals. This methodology supports Marmara University’s vision of being a leading institution in combating climate change.
The Greenhouse Gas Protocol is an international standard for analyzing and reporting greenhouse gas emissions. The protocol classifies emissions into three different approaches.
The Climate Action Plan included in this report adopts the GHG Protocol Institutional Standard for carbon emission analyses. Marmara University has been evaluated according to the GHG Protocol in terms of 3 carbon emission scopes.
GHG PROTOCOL IN TERMS OF 3 CARBON EMISSION SCOPES
Scope 1: Direct GHG emissions
These emissions are emissions from sources directly controlled by the company, such as combustion of equipment owned or operated by the company, such as vehicles, boilers and furnaces.
Scope 2: Electricity indirect GHG emissions
These emissions are indirect emissions from energy sources purchased by the company and occur during the production of energy types such as electricity, heat or steam.
Scope 3: Other indirect GHG emission
These emissions are considered other indirect emissions that occur in the company’s value chain. This scope includes a wide range of areas such as supply chain activities, business travel, and waste management, and are often the most difficult to measure.
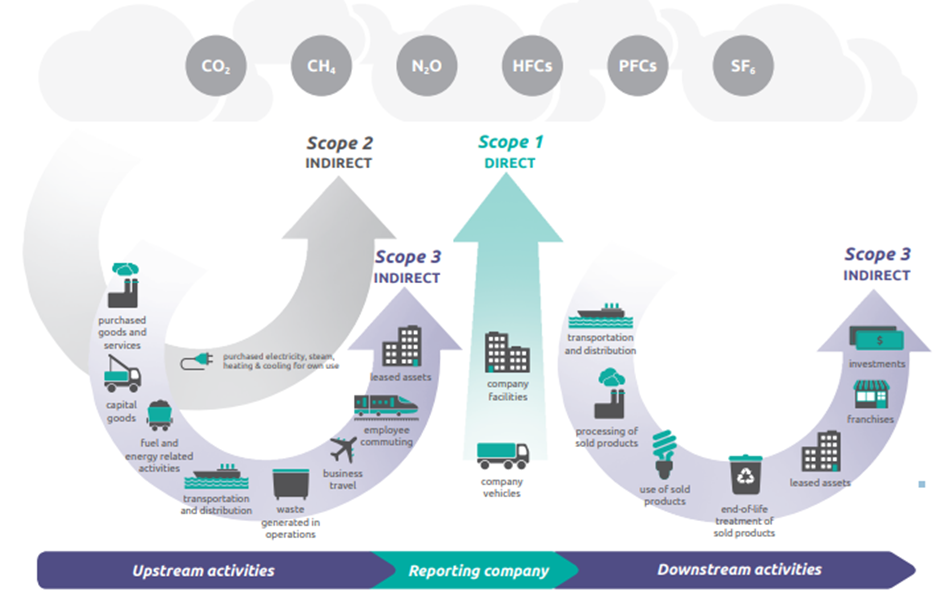
In carbon emission analyses, Marmara University used Scope 1 for calculations related to natural gas use, Scope 2 for electricity consumption, and Scope 3 for water, waste, and transportation. In 2023, the results for Recep Tayyip Erdoğan main complex in carbon emission analyses are as follows:
Scope 1 emission is determined as 980.017 kgCO2e
Scope 2 emission is calculated as 4.975.607 kgCO2e
Scope 3 is exemanied as 568.324 kgCO2e
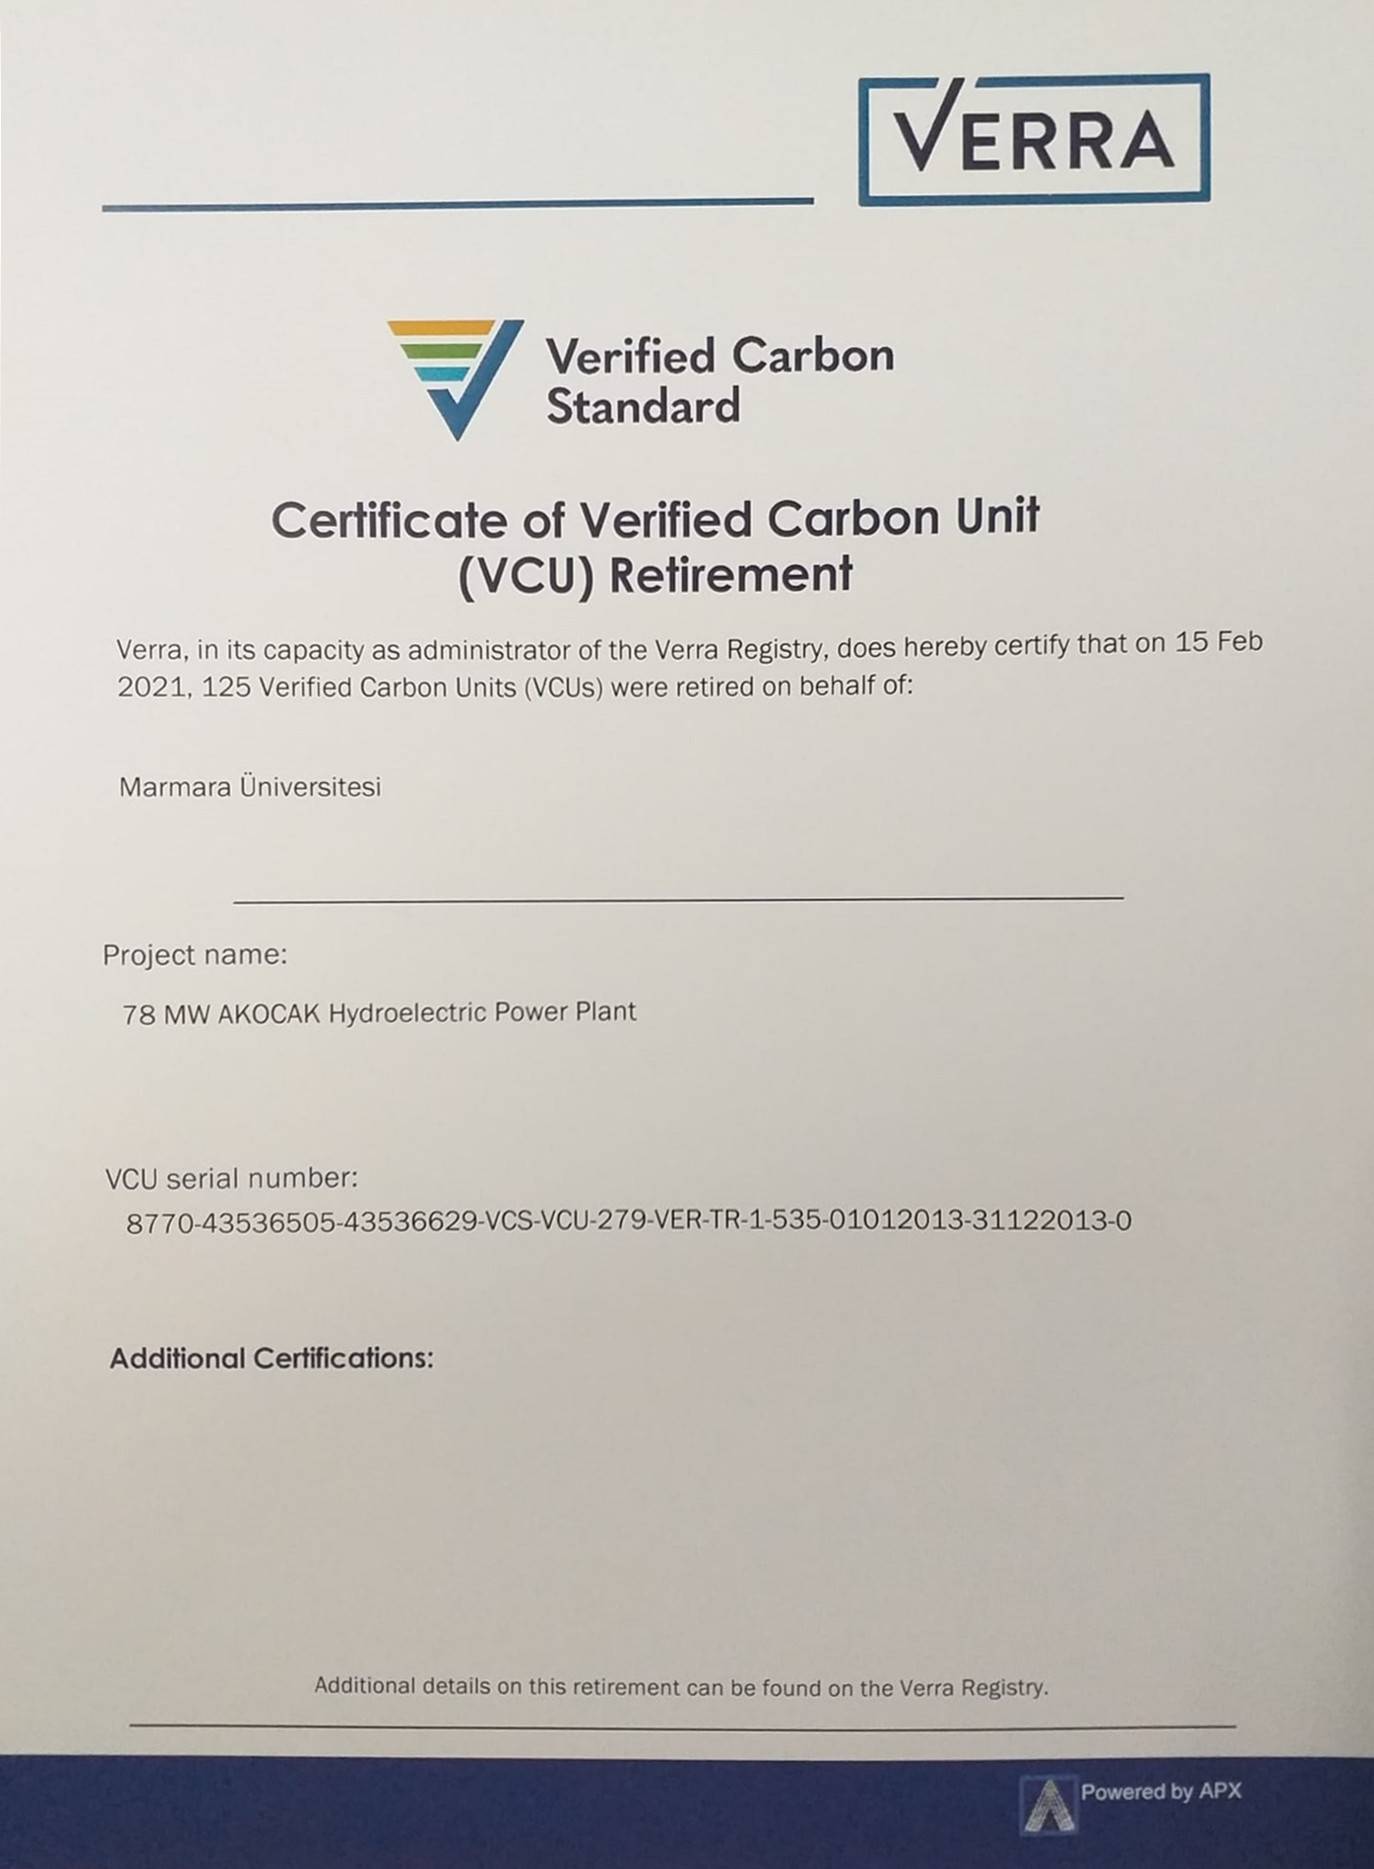
Verified Carbon Standard Certificate
Marmara University, which requested the energy distribution company SEPAŞ to send energy from renewable power plants, received the Verified Carbon Standard (VCS) certificate, which ensures carbon emission reduction in accordance with world standards. Thanks to this sensitive attitude towards the environment, Marmara University has helped reduce carbon emissions by 30 percent.
Marmara University Energy Management Unit Directive
Please click here: Marmara University Energy Management Unit Directive
As seen in Table 2, a decrease in electricity consumption has been achieved.
Table 2. Electricity Consumption
|
AREAS |
Years |
Trend |
|
|
2022 |
2023 |
||
|
Electricity Consumption Amount (Kwh) |
32.771.286 |
28.910.954 |
Reduction |
|
Electricity Consumption Amount Per Indoor Area (Kwh) |
47,11 |
39,07 |
Reduction |
|
Electricity Consumption (Personnel +Student) (Kwh) |
409,61 |
371,38 |
Reduction |
As seen in Table 3, there has been a decrease in natural gas consumption.
Table 3. Natural Gas Consumption
|
AREAS |
Years |
Trend |
|
|
2022 |
2023 |
||
|
Natural Gas Expense Consumption Amount (m3) |
3.171.537 |
1.566.981 |
Reduction |
|
Natural Gas Expense Per Closed Area (m3) |
4,56 |
2,12 |
Reduction |
|
Natural Gas Expense Per Person (Staff + Student) (m3) |
39,64 |
20,13 |
Reduction |
As seen in Table 4, there has been a decrease in telephone and internet access.
Table 4. Telephone and Internet Access Consumption
|
AREAS |
Years |
Trend |
|
|
2022 |
2023 |
||
|
Telephone and Internet Access Expenses (TL) |
255.847,49 |
124.302,45 |
Reduction |
|
Telephone and Internet Access Expenses per Personnel (TL) |
48,81 |
27,33 |
Reduction |
CARBON REDUCTION STRATEGY
Marmara University's 2023-2028 Action Plan reveals the steps taken towards becoming carbon neutral. Our university will continue its determination to develop innovative and effective solutions to achieve its carbon neutral goal at the same pace. Marmara University operates in 8 campuses distributed on the Anatolian and European sides of Istanbul. Of these, Acıbadem, Anadoluhisarı, Bağlarbaşı, Recep Tayyip Erdoğan Complex, Göztepe, Kartal, Mehmet Genç Complex campuses are on the Anatolian side and Sultanahmet campus is on the European side. The buildings on campuses other than the Recep Tayyip Erdoğan Complex are old and not designed as green building. In the near future, all of these campuses are planned to be gathered on the Recep Tayyip Erdoğan Complex and all new buildings will be constructed with features of green building. It is aimed to reach the highest level of energy efficiency in the buildings. In this context, elements such as maximum use of natural lighting, rainwater harvesting, green roof applications, gray water use, solar panels and insulation will be prioritized during the design phase. In addition, solar panels and wind turbines will be placed in the campus to meet energy needs. The transition from existing old buildings to new buildings will significantly reduce the carbon footprint. The buildings that will not be moved to the Recep Tayyip Erdoğan Complex are planned to be rebuilt or undergo a major renovation due to earthquake safety. Through this process, efficiency and the use of renewable energy will be prioritized in the design and ensured to reduce the carbon footprint. In the coming years, we will further increase our efforts in environmental responsibility and sustainability, focusing on our goal of creating impactful and lasting change both on our campuses and on a broader scale by awareness studies. Our carbon reduction hierarchy helps identify which actions will be most impactful and efficient.
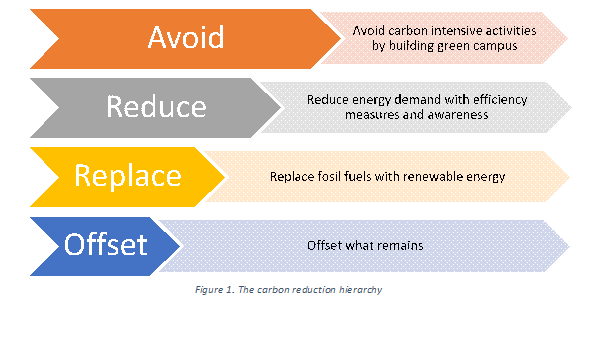
Total Carbon Footprint (Marmara University) are as follows:
|
a. Electricity usage per year CO2 (electricity) =electricity usage per year (kWh)1000×0,84 =16.539.420 kWh1000×0,84 = 13.893,11 metric tons
b. Transportation per year (Shuttle) =((9*72*1,5*240)/100)*0,01
c. Transportation per year (Car) =((600*2*1,5*240)/100)*0,01
d. Transportation per year (Motorcycle) =((55*2*1,5*240)/100)*0,02
e. Total emission per year = total emission from electricity usage + transportation (bus, car, motorcycle) =13.968 |
Our targets and implementation timeline are showed in the Table
|
Strategy/Time Period |
2023-2025 |
2026-2028 |
|
Building efficiency increase |
45% |
75% |
|
Renewable energy use |
40% |
90% |
|
Transportation carbon emission |
55% |
70% |
|
Forestation |
50% |
75% |
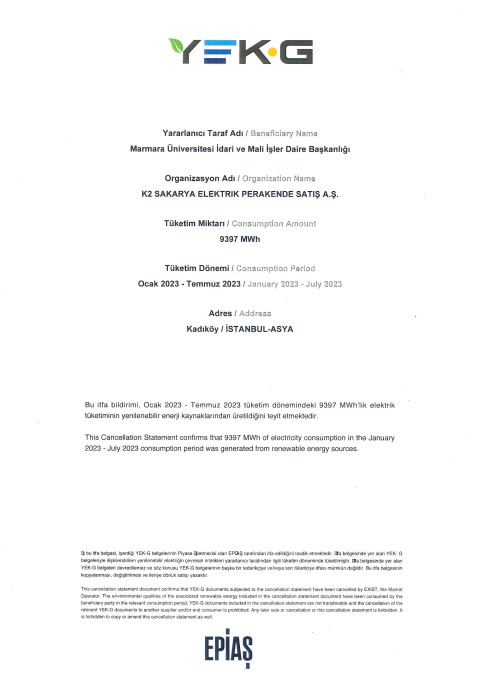
Click to see the Green Energy Certificate.
For detailed information: Renewable Energy
This page updated by Sürdürülebilirlik on 06.11.2024 10:38:16
